If you run Wazuh as a manager-only stack (no Indexer, no official Dashboard), you do not need Elastic/OpenSearch just to get a browser UI. Point Grafana — often the one already in your Kubernetes cluster — at the Wazuh REST API with the JSON Datasource plugin and you can chart agents, SCA/MITRE alerts, and parental-control DNS data in one place.
This is aimed at homelabs and small labs: see agents, basic alerts, and AdGuard blocks without deploying Indexer + Wazuh Dashboard. Everything here runs on a single host (raam): Docker manager, k8s Grafana, AdGuard, and setup scripts. Screenshot names and IPs are anonymized.
Spanish deep-dive (YAML, proxies, troubleshooting): Integrar Wazuh con Grafana sin Elasticsearch.
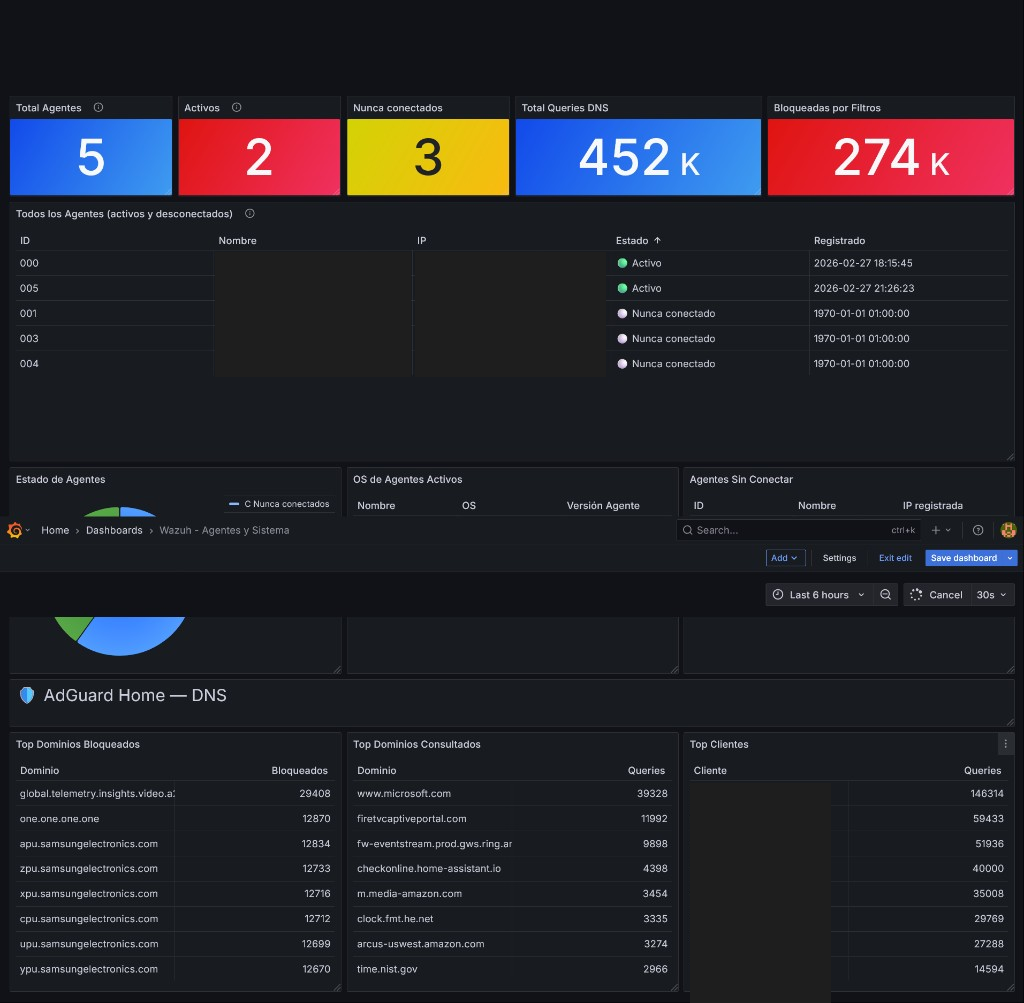
Screenshot of the “Wazuh - Agents and System” dashboard with AdGuard Home section as seen in Grafana on raam. Top: total agents, active, never connected, DNS queries and blocked. Bottom: agent table (IDs and status), status donut, DNS section with top blocked/queried domains and top clients.
Why I built it: I wanted to see agents, alerts and parental control from a proper screen, without depending on the phone (JuiceSSH, manager console) every time I check if an agent is up or what AdGuard is blocking. That’s the real problem: a single, lightweight interface in the browser.
Wazuh Grafana integration without Elasticsearch
The official Wazuh Dashboard depends on the Indexer (Elasticsearch/OpenSearch): you have to deploy index, ingestion and a frontend that queries that index. In a homelab or an environment where you only want agents, alerts and parental control without such a heavy stack, that becomes cumbersome.
The Wazuh manager REST API already exposes what you need: agent list, status, statistics, events. The idea is to use Grafana as the single interface: if you already have Grafana in Kubernetes (e.g. for other metrics), you only need a datasource that talks to that API. Grafana doesn’t have a native Wazuh datasource, but the marcusolsson-json-datasource plugin lets you set a base URL, authentication (Basic Auth) and make GET requests with parameters; the JSON response can be mapped to panels with JSONPath. So you skip Indexer and the official Dashboard: fewer components, less memory, less failure surface — in exchange for no heavy historical search. Grafana talks to the manager API (and optionally an alerts proxy over alerts.json).
In my case the Wazuh manager runs in Docker on the same host raam; Grafana runs inside the Kubernetes cluster also on raam (namespace monitoring), image 12.x, internal port 3030. The whole setup — Wazuh, Kubernetes, Grafana, AdGuard and dashboards — is on raam.
If you already use Wazuh for auditing Kubernetes or parental control with AdGuard and Telegram, having the same data in Grafana unifies the view in one place.
Architecture (overview)
- Browser → NodePort (e.g. 30300) → Grafana (pod in
monitoring) with marcusolsson-json-datasource. - Grafana datasources: Wazuh API (manager), AdGuard (via a small proxy that normalizes JSON), Wazuh Alerts (proxy that reads
alerts.jsonfrom the manager and exposes/stats,/alerts). - JWT renewal: CronJob (or host cron) every 10 minutes to get a new JWT and update the Wazuh datasource so it doesn’t stop working after 15 minutes.
Implementation overview
- Expose Grafana via NodePort so you can open it in the browser (e.g.
http://<node-IP>:30300). - Install the JSON plugin in Grafana (
marcusolsson-json-datasource, tested with 1.3.24). In Kubernetes, use an initContainer or a custom image so the plugin survives pod restarts. - Create the Wazuh API datasource with a fixed UID (so dashboard JSONs keep working). Use JWT or Basic Auth; if JWT, set up the renewal CronJob.
- AdGuard integration: The API returns “top” lists as objects with dynamic keys; JSONPath in panels doesn’t handle that well. Deploy a small proxy in the cluster that calls AdGuard, normalizes the JSON to fixed fields (e.g.
name,count) and serves it to Grafana. - Security alerts panel: The manager writes alerts to
/var/ossec/logs/alerts/alerts.json. Mount that directory from the host into the manager container; run an alerts proxy pod that reads it (read-only) and exposes HTTP endpoints (/health,/stats,/alerts?min_level=7&limit=30). Add a second JSON datasource in Grafana pointing to this proxy and build panels for totals, last hour, last 24h, by severity, by agent, recent alerts table, MITRE tactics. - Run the bootstrap script (once, or after reinstalling Grafana) to create the datasource and import dashboards:
GRAFANA_ADMIN_PASSWORD='...' WAZUH_PASSWORD='...' ./setup-wazuh-grafana.sh
(Lab filename may still besetup-wazuh-grafana-completo.sh.)
Important gotchas
| Symptom | Cause | Solution |
|---|---|---|
| “No data” every ~15 min | Wazuh JWT expired | Use a CronJob to renew JWT every 10 min and update the datasource; or use Basic Auth. Do not add jwt_expiration_timeout in api.yaml on 4.9.x — the option doesn’t exist and breaks wazuh-apid. |
| Manager rejects agent: “Incompatible version” | Agent version newer than manager | Install the same (or lower) version as the manager, e.g. apt-get install wazuh-agent=4.9.2-1 --allow-downgrades. |
| Manager doesn’t recognize agent (same host as Docker manager) | Connections come from Docker bridge IP (e.g. 172.18.0.1), not 127.0.0.1 | Register the agent with ip: any. |
| Panels show no requests / wrong field | Plugin 1.3.24 uses urlPath in queries, not path |
In dashboard JSON, use urlPath and avoid leading ? in query params (plugin adds it). |
| Manager unusable after “wazuh-control restart” inside container | Daemons in the container are not supervised by init; they don’t come back after stop | Use docker restart <container> to restart; or wazuh-control start (without stop) to only start stopped daemons. |
| Alerts not visible in Grafana | alerts.json only inside container |
Mount /var/ossec/logs from host into the manager container; then the alerts proxy can read it via hostPath. |
Limitations
This approach does not replace the full Wazuh stack (Indexer + official Dashboard). It’s a light solution for:
- Basic visualization of agents and status.
- Simple stats (counts, top N, status).
- Small environments: homelab, lab, testing.
It is not for complex search over historical events, advanced correlation, long-term indexed retention or forensic analysis on large volumes. There is no indexing: Grafana talks directly to the manager API and, if you add it, to the alerts proxy reading alerts.json. Vulnerability Detection (CVEs) without the Indexer does not persist results; SCA (CIS Benchmark) does write to alerts.json and is a good source for the alerts panel.
YAML snippets for the AdGuard proxy, alerts proxy API details, and the extended troubleshooting table: Spanish deep-dive.
Related: Auditing Kubernetes with Wazuh · Parental control with Wazuh, AdGuard and Telegram.